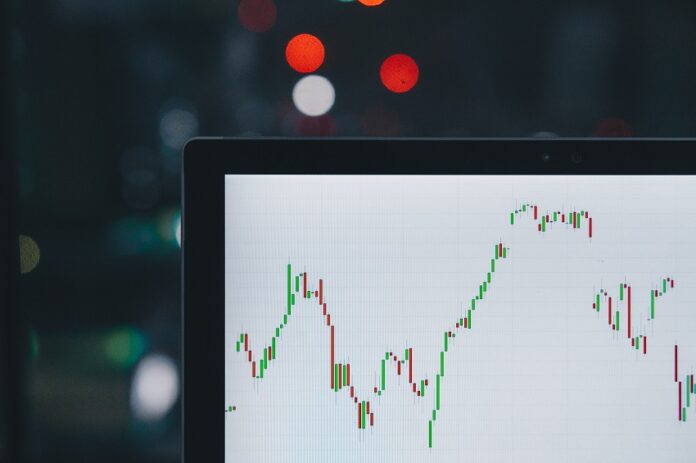
Are you tired of relying on fundamental analysis to make investment decisions? Are you ready to try a new approach that can give you a competitive edge in the market? If so, technical analysis may be just what you’re looking for. With that said, here is a detailed outlook on what technical analysis is and what tools and methods are used in technical analysis.
What is Technical Analysis?
Analysis of the market is essential for trading. Technical analysis is a technique of assessing securities by examining statistical data engendered by market activity, such as volumes and past prices. It’s all about using resources available on a website about online trading, such as charts, patterns, and indicators, to identify trends and predict future activity. It helps traders to make more informed decisions and avoid getting trapped in emotional trading cycles.
Why Use Technical Analysis?
Technical analysis can be a powerful tool for investors and traders because it helps you to:
- Identify trends and patterns in the market.
- Confirm trends and patterns using indicators.
- It can provide insights into the sentiment of market participants, which can be useful for identifying potential buying or selling opportunities.
- Technical analysis can be used to identify exit and entry points for trades, helping traders and investors to maximize their returns.
- Make more informed investment decisions.
One of the key benefits of technical analysis is that it can be applied to any security, including stocks, bonds, futures, and currencies. This means that you can use it to analyze a wide range of investment opportunities and make more informed decisions.
Tools of the Trade: Charting and Patterns
One of the most essential tools in technical analysis is the chart. Charts allow you to visualize the price and volume data for securities and identify trends and patterns that can provide clues about their future direction.
Head & Shoulders
One of the best-known patterns in technical analysis is the head and shoulders pattern. This pattern consists of three peaks, the head or the highest peak is the middle peak and the shoulders are two outside peaks being lower. This pattern is thought to be a bearish signal, indicating that the security’s price is likely to decline.
Uptrend and Downtrend
Another commonly used pattern is the uptrend and downtrend. An uptrend is a situation in which the price of a financial asset, such as a stock or a currency, is generally increasing over time. It is characterized by higher highs and higher lows, where each successive peak and trough is higher than the previous one.
A downtrend, on the other hand, is a series of lower highs and lower lows. These trends can be identified using trendlines, which are drawn by connecting the highs or lows of a security over a given period of time. A break of the trendline can indicate a change in the trend.
Trading Indicators: The Cherry on Top
In addition to charting and patterns, technical analysts also use indicators to confirm trends and patterns or provide warning signs of a potential reversal. The relative strength index (RSI), moving averages, and the stochastic oscillator are some common indicators that are useful in technical analysis.
Moving Averages
Moving averages are a widely used indicator that smooths out price data by creating a constantly updated average price. The most common moving averages are the 50-day, 100-day, and 200-day moving averages. These averages can be used to identify trends, as well as to generate buy and sell signals.
Relative Strength Index or RSI
The RSI is intended to analyze the current and historical strength or weakness of a security or currency grounded on the closing prices of a recent trading period. It is calculated by dividing the average gain of a security over a given period by the average loss over the same period. RSI ranging between 35 and 65 is considered to be optimal as anything above that is considered overbought, while a value lower than the given range is considered oversold.
Stochastic Oscillator
The stochastic oscillator assumes that the price of the stock tends to be very close to the high in an uptrend, and it tends to be very close to the low in a downtrend. In simple words, it’s a momentum chart that helps you decide which way the market might be heading on the basis of the current price. It is calculated by dividing the current closing price by the highest price over the period and then multiplying by 100. A reading above 80 is generally considered overbought, while a reading below 20 is considered oversold.
A Word of Caution
While technical analysis can be a convenient means for recognizing trends and making suitable investment decisions, remember that it is not a seamless science. Technical analysis is grounded on the idea of market efficiency, but markets are not always efficient, and past performance is not necessarily indicative of future results. In addition, the technical analysis relies on the assumption that price and volume data accurately reflect all relevant information, which may not always be the case.
Ending Thoughts
Despite these limitations, many traders and investors consider technical analysis as a valuable tool for analyzing securities and making investment decisions. With practice and discipline, technical analysis can be a powerful addition to your investment toolkit.
So, why not give it a try? Dive into the world of technical analysis and see how it can help you make smarter investment decisions.


